Selasa, 05 Juni 2012

Metode analisis dengan reaksi reduksi-oksidasi (redoks) adalah analisis yang terdiri dari perubahan valensi dari bahan-bahan yang bereaksi. Reaktan yang mengalami kehilangan elektron dalam reaksi redoks adalah bahan pereduksi dan dapat diidentifikasi dari persamaan untuk reaksi dimana atom reaktan dikonversi ke tingkat yang lebih tinggi (1) :
Fe2+ ————>   Fe3+ + e
2I- ————->   I2 + 2e
Maka, bahan pengoksidasi adalah reaktan yang menerima elektron dalam reaksi redoks.
Reaksi yang reversible dari 2I- I2 + 2e dapat diaplikasikan dalam analisis bahan-bahan pereduksi seperti tiosianat dan arsenit. (1)
Iodimetri adalah oksidasi kuantitatif dari senyawa pereduksi dengan menggunakan iodium. Iodimetri ini terdiri dari 2, yaitu (2);
a.    Iodimetri metode langsung, bahan pereduksi langsung dioksidasi dengan larutan baku Iodium. Contohnya pada penetapan kadar Asam Askorbat.
b.    Iodimetri metode residual ( titrasi balik), bahan pereduksi dioksidasi dengan larutan baku iodium dalam jumlah berlebih, dan kelebihan iod akan dititrasi dengan larutan baku natrium tiosulfat. Contohnya pada penetapan kadar Natrium Bisulfit.
Iodometri adalah bahan pengoksidasi yang mengoksidasi Kalium iodida (KI) dalam suasana asam, sehingga Iod yang dibebaskan kemudian ditentukan dengan menggunakan larutan baku Natrium tiosulfat. Contohnya pada penetapan kadar Tembaga (II) sulfat. (2)
Hal-hal yang harus diperhatikan (2,3):
a.    Pada umumnya oksidasi langsung dengan iod (Iodimetri) dilakukan untuk bahan-bahan dengan potensial oksidasi yang lebih rendah dari Iod, dan sebaliknya.
b.    Oksidasi oleh oksigen atmosfer pada reaksi oksidasi KI dalam medium asam kuat, dapat menghasilkan nilai titer yang salah sehingga menyebabkan kesalahan estimasi/perkiraan.
c.    Iodometri tidak pernah dilakukan dalam medium basa karena reaksi antara Iod (I2) dengan hidroksida akan menghasilkan ion hipoiodit dan iodat akan akan menjadi 2I-. Dimana 2 mol I- akan mengoksidasi parsial tiosulfat menjadi bentuk oksidasi yang lebih tinggi seperti SO42-
Penentuan titik akhir titrasi (1,2,3,4) :
a.    Indikator kanji ( konsentrasi 0,5% yang dibuat segar dengan menggunakan pati larut yaitu β-amilosa).
b.    Instrument : Potensiometri atau amperometri.
c.    Warna iod dalam pelarut organik misalnya karbon tetraklorida dan kloroform. ( khusus untuk titrasi yang tidak memungkinkan penggunaan indicator kanji, sehingga tidak perlu ditambahkan indikator). Warna merah ungu dari iodin dalam karbon tetraklorida dapat dilihat pada larutan iodin dengan kepekatan yang sangat rendah, sifat inilah dipakai untuk menentukan titik akhir titrasi dengan hilangnya warna merah ungu pada lapisan karbon tetraklorida.Selain karbon tetraklorida, dapat juga dipakai kloroform sebagai indikator dengan sifat yang sama dengan karbon tetraklorida.

Larutan baku dan baku primer/sekunder (1,2,3,4) :
a.    Larutan baku Iodium yang dibakukan dengan Arsen trioksida sebagai baku primer atau dibakukan dengan larutan baku natrium tiosulfat sebagai baku sekunder.
b.    Larutan baku natrium tiosulfat yang dibakukan dengan Kalium bikromat sebagai baku primer atau dibakukan dengan larutan baku Iodium sebagai baku sekunder.
c.    Larutan baku Kalium Bromat yang dibakukan dengan larutan baku natrium tiosulfat sebagai baku sekunder. ( dipakai untuk penetapan kadar secara iodometri yang melibatkan substitusi bromine dengan iod, misalnya penetapan kadar tiroid)
d.    Larutan baku kalium Iodat yang dibakukan dengan larutan baku natrium tiosulfat. ( dipakai untuk penetapan kadar secara iodometri dimana kalium iodat bertindak sebahan bahan pengoksidasi, hasil reaksi membebaskan iod yang kemudian dititrasi dengan larutan baku natrium tiosulfat, misalnya penetapan kadar Kalium iodide)

Referensi :
1.    Adelbert M. Knevel (Ed.). Jenkin’s : Quantitative Pharmaceutical Chemistry, 7th Edition. 1959. MC-Graw Hill Book Company. New York.
2.    Ashutosh Kar. Pharmaceutical Drug Analysis. 2005. New Age International Limited Publishers. New Delhi.
3.    I.M. Kollthoff (Ed.). Volumetric Analysis. MC-Graw Hill Book Company. New York.
4.    Yeanny Wunas & Susanti Said. Kimia Analisis Kuantitatif. 1998. Lembaga Penerbitan Universitas Hasanuddin. Makassar.
Permanganometri merupakan metode titrasi dengan menggunakan kalium permanganat, yang merupakan oksidator kuat sebagai titran. Titrasi ini didasarkan atas titrasi reduksi dan oksidasi atau redoks. Kalium permanganat telah digunakan sebagai pengoksida secara meluas lebih dari 100 tahun. Reagensia ini mudah diperoleh, murah dan tidak memerlukan indikator kecuali bila digunakan larutan yang sangat encer. Permanganat bereaksi secara beraneka, karena mangan dapat memiliki keadaan oksidasi +2, +3, +4, +6, dan +7 (Day, 1999).
Dalam suasana asam atau [H+] ≥ 0,1 N, ion permanganat mengalami reduksi menjadi ion mangan (II) sesuai reaksi :
MnO4- + 8H+ + 5e- Mn2+ + 4H2O Eo = 1,51 Volt
Dalam suasana netral, ion permanganat mengalami reduksi menjadi mangan dioksida seperti reaksi berikut :
MnO4- + 4H+ + 3e- MnO2 + 2H2O Eo = 1,70 Volt
Dan dalam suasana basa atau [OH-] ≥ 0,1 N, ion permanganat akan mengalami reduksi sebagai berikut:
MnO4- + e- MnO42- Eo = 0,56 Volt
(Svehla, 1995).
Asam sulfat adalah asam yang paling sesuai, karena tidak bereaksi terhadap permanganat dalam larutan encer. Dengan asam klorida, ada kemungkinan terjadi reaksi :
2MnO4- + 10Cl- + 16H+ 2Mn2+ + 5Cl2 + 8H2O
dan sedikit permanganat dapat terpakai dalam pembentukan klor. Reaksi ini terutama berkemungkinan akan terjadi dengan garam-garam besi, kecuali jika tindakan-tindakan pencegahan yang khusus diambil. Dengan asam bebas yang sedikit berlebih, larutan yang sangat encer, temperatur yang rendah, dan titrasi yang lambat sambil mengocok terus-menerus, bahaya dari penyebab ini telah dikurangi sampai minimal. Pereaksi kalium permanganat bukan merupakan larutan baku primer dan karenanya perlu dibakukan terlebih dahulu. Pada percobaan ini untuk membakukan kalium permanganat ini dapat digunakan natrium oksalat yang merupakan standar primer yang baik untuk permanganat dalam larutan asam (Basset, 1994).
Untuk pengasaman sebaiknya dipakai asam sulfat, karena asam ini tidak menghasilkan reaksi samping. Sebaliknya jika dipakai asam klorida dapat terjadi kemungkinan teroksidasinya ion klorida menjadi gas klor dan reaksi ini mengakibatkan dipakainya larutan permanganat dalam jumlah berlebih. Meskipun untuk beberapa reaksi dengan arsen (II) oksida, antimoni (II) dan hidrogen peroksida, karena pemakaian asam sulfat justru akan menghasilkan beberapa tambahan kesulitan. Kalium pemanganat adalah oksidator kuat, oleh karena itu jika berada dalam HCl akan mengoksidasi ion Cl- yang menyebabkan terbentuknya gas klor dan kestabilan ion ini juga terbatas. Biasanya digunakan pada medium asam 0,1 N. Namun, beberapa zat memerlukan pemanasan atau katalis untuk mempercepat reaksi. Seandainya banyak reaksi itu tidak lambat, akan dijumpai lebih banyak kesulitan dalam menggunakan reagensia ini (Svehla, 1995).
MnO4- + 8H+ + 5e Mn2+ + 4H2O E0 = 1,51V
III. ALAT DAN BAHAN

A. Alat

Alat-alat yang digunakan dalam percobaan ini adalah neraca analitik, statif, buret, sudip, botol semprot, erlenmeyer 250 ml, corong, gelas beker 200 ml, labu ukur 100 ml, krus porselin, eksikator, oven, dan pipet tetes.
B. Bahan
Bahan-bahan yang digunakan dalam percobaan ini adalah larutan KMnO4 0,1 N, aquades, larutan H2SO4 0,75 N, larutan sampel nitrit, padatan CaCO3, indikator metil merah, garam NH4 oksalat, larutan Na2C24, larutan H2SO4 1:8.
IV. PROSEDUR KERJA
A. Pembakuan Larutan Kalium Permanganat
1. Diambil 10 ml larutan Na2C24 dengan menggunakan pipet volum 10 ml. Dititrasi dengan larutan KMnO4 0,1 N. Dilakukan duplo.
B. Penentuan Kalsium (Ca2+) dalam CaCO3
1. Ditimbang 0,1 gram padatan CaCO3 dengan menggunakan neraca analitik. Dimasukkan ke dalam beaker glass 400 ml.
2. Aquades ditambahkan sampai volume menjadi 100 ml. Ditambahkan beberapa tetes indikator metil merah ke dalam larutan. Dipanaskan larutan tersebut sampai mendidih.
3. Ditambahkan larutan dari 0,75 gram NH4 oksalat dalam 12,5 ml aquades secara perlahan-lahan. Dipanaskan pada temperatur 70-80°C selama 15 menit.
4. 3 tetes larutan amonia (1:1) ditambahkan sambil diaduk secara perlahan. Dibiarkan larutan dalam keadaan panas selama 1 jam. Disaring endapan dengan menggunakan kertas saring Whatman No.540.
5. Dicuci endapan dengan aquades hingga bebas dari oksalat. Dilubangi kertas saring dengan menggunakan pengaduk.
6. Dibilas endapan dengan larutan asam sulfat (1:8) ke dalam erlenmeyer yang lain. Dicuci kertas saring dengan aquades panas sampai volume 50 ml. Dititrasi dengan larutan KMnO4 0,1 N setelah semua endapan larut.

Pembahasan
1. Pembakuan Larutan Kalium Permanganat
Titrasi permanganometri digunakan untuk menetapkan kadar reduktor dalam suasana asam sulfat encer dengan menggunakan kalium permanganat sebagai titran. Dalam suasana penetapan basa atau asam lemah akan terbentuk endapan coklat MnO2 yang menggangu.
MnO4- + 8H+ + 5e Mn2+ + 4H2O (dalam sulfat encer)
MnO4- + 4H+ + 3e MnO2 + 2H2O (dalam asam lemah)
MnO4- + 2H2O + 3e MnO2 + 4OH- (dalam basa lemah)
Kalium permanganat merupakan zat pengoksidasi yang sangat kuat. Pereaksi ini dapat dipakai tanpa penambahan indikator, karena mampu bertindak sebagai indikator. Oleh karena itu pada larutan ini tidak ditambahkan indikator apapun dan langsung dititrasi dengan larutan Natrium oksalat merupakan standar yang baik untuk standarisasi permangnat dalam suasana asam. Larutan ini mudah diperoleh dengan derajat kemurnian yang tinggi. Reaksi ini berjalan lambat pada temperatur kamar dan biasanya diperlukan pemanasan hingga 60ºC. Bahkan bila pada temperatur yang lebih tinggi reaksi akan berjalan makin lambat dan bertambah cepat setelah terbentuknya ion mangan (II). Pada penambahan tetesan titrasi selanjutnya warna merah hilang semakin cepat karena ion mangan (II) yang terjadi berfungsi sebagai katalis, katalis untuk mempercepat reaksi. Dari hasil perhitungan maka didapatkan nilai normalitas dari KMnO4 adalah sebesar 0,7164 N. Pada standarisasi larutan KMnO4 dengan menggunakan larutan standar Na2S2O4 berlangsung reaksi sebagai berikut:
2Na+ + C2O4- + 2H+ H2C2O4 + 2Na+
2MnO4 + 5H2C2O4 + 6H+ 2Mn2+ + 10CO2 + 8H2O
2. Penentuan kalsium (Ca2+ ) dalam CaCO­­3
Penentuan kadar Ca2+ dalam CaCO3 dilakukan dengan pembuatan larutan terlebih dahulu. Larutan kemudian dipanaskan untuk menghilangkan adanya ion-ion pengganggu atau pengotor yang dapat mempengaruhi hasil yang akan dicapai. Kemudian CaCO3 direaksikan dengan ammonium oksalat menurut persamaan reaksi sebagai berikut:
CaCO3 + (NH4)2C2O4 → CaC2O4­­ ↓ + (NH4)2CO3
Penambahan ammonium oksalat ini karena ammonium oksalat digunakan sebagai bahan pengendap kalsium langsung yang memberikan ion C2O42-, karena mengion. Cara ini disebut dengan homogenus presipitasi, yaitu cara pembentukan endapan dengan menambahkan bahan pengendap tidak dalam bentuk jadi, melainkan sebagai suatu senyawa yang dapat menghasilkan pengendapan tersebut. Penambahan ammonium oksalat merupakan penambahan ion sejenis pada larutan, sehingga ia akan memperbesar peluang terbentuknya endapan kalsium oksalat. Penambahan ammonia dengan perbandingan 1:1 digunakan untuk membuat suasana reaksi menjadi lebih alkalis. Hal ini terlihat dari warna larutan yang menjadi kekuningan. Endapan yang terbentuk setelah larutan yang telah dipanaskan didiamkan dipisahkan dari filtratnya. Filtrat yang dipisahkan harus benar-benar bebas dari Ca-oksalat, karena itu endapan diuji dengan ammonium oksalat di mana apabila penambahan ammonium oksalat tidak menyebabkan terbentuknya endapan, maka filtrat bebas dari endapan Ca-oksalat.
Endapan yang diperoleh kemudian dibilas dengan akuades untuk menghilangkan ion oksalat dan kemudian ke dalamnya ditambahkan asam sulfat panas (1:8) untuk memberi suasana asam dan larutan diencerkan dengan air panas sampai 100 ml. Reaksi yang terjadi adalah sebagai berikut:
CaC2O4 + H2SO4 → H2C2O4 + CaSO4
Asam oksalat yang terbentuk inilah yang kemudian bereaksi dengan ion permanganat dari titrasi dengan KMnO4. Titrasi dilakukan sampai warna larutan yang semula bening menjadi berwarna merah muda. Persamaan reaksinya adalah sebagai berikut:
2MnO4- + 5H2C2O4 + 6H+→ 2Mn2+ + 10CO2 + 8H2O
Volume titrasi KMnO4 yang digunakan untuk menentukan kadar Ca2+ dalam CaCO3.adalah 1,35 ml. Sehingga dari hasil perhitungan diperoleh kadar Ca2+ sebesar 39,46%.
VI. KESIMPULAN
Kesimpulan yang dapat diambil dari percobaan ini adalah:
1. Permanganometri merupakan titrasi oksidasi reduksi dengan mempergunakan larutan baku kalium permanganat (KMnO4).
2. Dari hasil perhitungan maka didapatkan nilai normalitas dari KMnO4 adalah sebesar 0,7164 N.
3. Kadar Ca2+ dalam CaCO3 adalah 39,46%.
4. Tujuan dari pencucian endapan adalah agar larutan induk dan zat pengotor yang melarut pada endapan dapat dihilangkan.
DAFTAR PUSTAKA
Basset. J etc. 1994. Buku Ajar Vogel, Kimia Analisis Kuantitatif Anorganik. Penerbit Buku Kedokteran EGC. Jakarta.
Day, R. A. Dan Underwood, A. L. 1999. Analisis Kimia Kuantitatif. Erlangga. Jakarta.
Svehla, G. 1995. Vogel Buku Teks Analisis Anorganik Kualitatif Makro dan Semimakro. Kalman Media Pustaka. Jakarta.

10 Cara Diet Sehat & Sederhana

  1. Pertama-tama kenali tubuh sendiri.
    Berhentilah membandingkan dengan tubuh teman-teman Anda. Saat Anda mengenal cara kerja tubuh sendiri, maka akan lebih mudah untuk memenuhi apa yang dibutuhkannya.
  2. Makan secara teratur dengan menu dan porsi yang cukup.
    Seperti kata pepatah, "Makanlah sebelum lapar dan berhentilah sebelum kenyang."
  3. Lebih banyak konsumsi buah dan sayur.
    Orang langsing rata-rata makan lebih dari satu sajian buah dan makan lebih banyak serat dan kurang lemak dibanding orang gemuk. Itu hasil penelitian yang dipublikasikan di Journal of the American Dietetic Association tahun 2006.
  4. Jangan lupakan Sarapan pagi
    Mulailah hari dengan menu dan porsi sarapan yang cukup. Ini akan membantu mengurangi asupan kalori di sepanjang sisa hari.
  5. Perbanyak Minum air putih.
    Cukupi kebutuhan air putih anda minimal 2 liter per hari.
  6. Berolahragalah.
    Jadikan itu sebagai kegiatan yang tidak bisa dikompromikan lagi.Ber-aerobik dengan musik kesukaan bisa menjadi aktivitas yang menyenangkan. Ajak keluarga untuk ikut bergerak. Awalnya mungkin agak aneh mendengarnya. Tapi begitu Anda mulai, bisa-bisa Anda lupa berhenti.
  7. Bebas Gula
    Cobalah 2 minggu tanpa gula. Rasanya luar biasa mengetahui napsu makan Anda yang biasanya tak bisa dipendam berangsur-angsur menghilang.
  8. Jangan melakukan tindakan ekstrim.
    Tindakan ekstrim maksudnya seperti sama sekali tak makan demi kurus dalam waktu cepat. Yang terbaik adalah makan dalam porsi sedikit, yang mencakup tiga nutrisi yang dibutuhkan tubuh dan dua camilan tiap hari untuk metabolisme yang lebih efisien.
  9. Gosok gigi segera
    Setelah makan malam segera gosok gigi untuk mengingatkan diri Anda bahwa waktu makan sudah habis.
  10. Jangan sekali-kali kompensasikan perasaan ke makanan.
    Kebiasaan yang sangat tidak baik bila kita makan berlebih di saat-saat perasaan kita sedang buruk ataupun terlalu gembira. Pada umumnya orang yg terlalu terbawa emosi sesaat agak susah mengontrol pola makannya.
Jadi... Ubah pola makan Anda dengan pola Sarapan yang Sehat

Trichomonas vaginalis / Wet prep test


Trikomoniasis dan Penatalaksanaannya

AM Adam, Hardy Suwita
SMF Kulit dan Kelamin RSUD Lambuang Baji, Makassar

Trikomoniasis adalah infeksi Trichomonas vaginalis yang merupakan protozoa patogen pada saluran genito-urinaria manusia. Berbagai macam gejala klinis dapat ditemukan baik pada wanita maupun pria dan diagnosis pasti adalah dengan menemukan organisme ini. Hingga saat ini metronidasol masih merupakan obat pilihan untuk trikomoniasis.

ETIOLOGI Trikomonas adalah suatu organisme eukaryotik yang termasuk kelompokmastigophora, mempunyai flagel, dengan ordo trichomonadida. Terdapat lebih dari 100 spesies, sebagian besar trichomonas merupakan organisme komensal pada usus mamalia dan burung. Terdapat 3 spesies yang sering ditemukan pada manusia yaitu Trichomonas vaginalis yang merupakan parasit pada saluran genitourianaria, Trichomonas tenax dan Pentatrichomonas hominis merupa-kan trichomonas non patogen yang ditemukan di rongga mulut untuk Trichomonas tenax dan usus besar untuk Pentatrichomonas
hominis .

Nama Trichomonas vaginalis sebenarnya salah, karena juga ditemukan di uretra wanita dan tidak jarang ditemukan di uretra pria.

Organisme ini berbentuk oval atau fusiformi, atau seperti buah pir dengan panjang rata-rata 15 mm dengan tanda khas selalu berpindah tempat. Intinya terletak anterior, antara inti dan permukaan ujung yang lebih luas terdapat 1 atau lebih struktur yang membulat yang disebut blepharoplasts dan dari tempat inilah keluar keempat flagel. Flagel kelima berbentuk membran bergelombang yang berasal dari kompleks kinetosomal dan terbentang sepanjang setengah dari organisme ini

Pergerakannya dengan kedutan yang didorong oleh keempat flagel anterior, kecepatan dan aktivitas hentakannya yang khas menyebabkan organisme ini mudah diidentifikasi pada sediaan segar.

Trichomonas vaginalis tumbuh di lingkungan yang basah dengan suhu 35-37º C dengan pH antara 4,9-7,5

Trichomonas vaginalis tidak menyerang jaringan di sebelah bawah dinding vagina, ia hanya ada di rongga vagina; sangat jarang ditemui di tempat lain. Lingkungan vagina sangat disukai oleh organisme ini

Trichomonas vaginalis dapat menimbulkan reaksi radang pada rongga vagina yang didominasi oleh sel lekosit polymorphonuclear (PMN). Trichomonas vaginalis dan ekstraknya dapat merangsang kemotaktik sel lekosit PMN, yang mungkin mempengaruhi perkembangan gejalanya.

Mekanisme lengkap penghancuran sel epitel vagina yang diserang oleh Trichomonas vaginalis belum diketahui dengan pasti.

Pria yang mengandung Trichomonas vaginalis sebagian besar asimtomatik dan respon radang pada uretra pria biasanya tidak ditemukan. Hal ini berhubungan dengan epitel kuboid pada uretra. Trichomonas vaginalis dapat menginfeksi epitel skuamosa pada vagina tetapi hanya yang rentan saja.

Cara menghilangkan Trichomonas vaginalis dari saluran urogenital pria belum diketahui pasti, tetapi mungkin organisme hilang secara mekanik pada waktu buang air kecil dan adanya seng di dalam cairan normal prostat dapat dengan cepat membunuh trichomonas

PENULARAN
Trichomonas vaginalis menular melalui hubungan seksual meskipun masih diperdebatkan

Trichomonas vaginalis dapat hidup pada obyek yang basah selama 45 menit pada kloset duduk, kain lap pencuci badan, baju, air mandi dan cairan tubuh

Penularan perinatal terjadi kira-kira 5% dari ibu yang terinfeksi tetapi biasanya sembuh sendiri dengan metabolisme yang progresif dari hormon ibu

Infeksi Trichomonas vaginalis mempunyai masa inkubasi selama 4-21 hari

LABORATORIUM
Pemeriksaan mikroskop secara langsung
Dengan sediaan basah dapat ditemukan protozoa dengan 4-5 flagel dan ukuran 10-20 µm yang motil

Pada wanita metode ini mempunyai sensitifitas 50- 70% dan spesimen harus diambil dari vagina karena agen penyebab hanya menyerang epitel skuamosa

Pada pria cara penemuan Trichomonas vaginalis tidak selalu berhasil dan Trichomonas vaginalis dapat dideteksi dengan menggunakan sedimen urin

Cara lain menggunakan pewarnaan Gram, Giemsa, Papa-nicolaou, Periodic acid schiff, Acridine orange, Fluorescein, Neutral red dan Imunoperoxidase

Kultur
Teknik kultur menggunakan berbagai cairan dan media semi solid yang merupakan baku emas untuk diagnosis Biasanya dengan menggunakan medium Feinberg-Whittington memberikan hasil yang dapat dipercaya
Teknik kultur ini mempunyai sensitifitas kira-kira 97%

Metode serologi
Beberapa studi mengatakan bahwa uji serologis kurang sensitif daripada kultur atau pemeriksaan sediaan basah
Pada metode serologi ini dapat digunakan teknik ELISA, tes latex agglutination yang menggunakan antibodi poliklonal
Antigen detection immunoassay yang menggunakan antibodi
monoklonal dan nucleic acid base test

http://www.kalbe.co.id


Article in English:

Purpose: Definitive diagnosis of Trichomonas vaginalis in genital secretions because clinical symptoms and signs or cellular charateristics of the exudate are not reliable evidence of trichomonal infections in either sex.

Equipment and Materials required:
Light microscope
microscope slides and cover slip
0.85% Saline, isotonic

Quality Control:

Specimen Collection and Handling: Specimens are collected by the health care practitioner. Follow Universal Precautions

1. Using a sterile swab , collect vaginal or, prostatic fluid, urethral discharges or centrifuge a fresh urine sample from either sex.
2. Specimen is mixed with a drop of isotonic saline solution. Cover slip the mixture.
3. Transport slide directly to the laboratory for examination.

Reporting:
1. Examine the slide microscopically using the 10 x objective for scanning and the 40 or 45 objective for confirmation and count estimation.
2. Trophozoites of T. Vaginalis may be incredibly numerous or only a few may be found. Motile and non-motile flagellates may be present, resembling small WBCs and epithelial debris.
3. Organisms are large, 15 to 18.5 by 5-15 um., pyriform, flagellate exhibiting rapid and jerky motility ( in fresh samples only). The wave-like motion of the undulating membrane is often apparent. There is not cyst stage of this parasite.
4. Report as follows:
*Presence of T. vaginalis, crystals and yeast as : Observe several fields under high power (400X) Report the presence as: Rare or Occasional or Many

*WBC, RBC, Epithelial cells, Renal cells – report lowest to the highest number of each element found as range/ HPF. Example: WBC 0-5/HPF

*Casts- observe several fields under low power (100X) report the lowest to highest number of each type of case found as range /LPF, Example: Granular cast 0-5/LPF

Reference:
1.Current Medial Diagnosis & Treatment ,1997
2. Saunders Manual of Clinical Laboratory Science, Lehmann, 1998
Papers Nutrient (Protein)
kwashiorkor.


INTRODUCTION
A. BACKGROUND.Is still quite vulnerable to nutritional problems in some parts of Indonesia, especially in urban slum areas, which often hit the dry season (NTB and NTT). Where conditions are a lot of people who are malnourished, many children are affected by malnutrition. Malnutrition / malnutrition often occurs due to an unbalanced diet, especially in terms of protein.Protein is essential to help the growth of children, and increase their endurance. And also the excess protein will also cause diseases such as obesity. So can cause diseases such as kwashiorkor, marasmus, and obesity.Therefore, in addition to fulfilling duties in the course "fundamentals of the science of nutrition", the author picked up the title of the protein, because protein is the most important substances that must exist in the human body. But masuh many cases also protein-energy malnutrition (PEM). Here the authors are interested to explore more of the protein.
2. Purposea. General purpose.That students and readers understand the importance of protein for our body.b. Special Purpose. To put the problem of protein Describe the content and function of protein for humans Inform the student source of protein Explain the result and the lack of protein Etc.
CHAPTER IITHEORETICAL REVIEW
A. UnderstandingThe term comes from the Greek protein proteos, which means the primary or precedence. This word is in my perkenal by the Dutch chemist, Gerardus Mulder (1802-1880). He argues that the protein is the most important substance in any organism.Protein is part of all living cells and is the largest part of the body after water. One fifth of the body is present in muscle protein separohnya, fifth in the bone and cartilage, and the rest kilit spersepuluh in the other tissues and body fluids. All enzymes, hormones pengengkut various nutrients and blood. Besides amino acids that make up the protein acts as a precursor, most coenzymes, hormones, nucleic acids, and molecular-molekuk essential for life.The protein has a unique function that can not be replaced by other chemicals, which build and maintain cells and tissues.
2. Protein Classification.Proteins present in the form of fibers (fibrous), globular, and kunjngsi.a. Porotein in the form of fibers.Consisting of several spiral peptide chains and interwoven with one another, making it resemble a rigid batany.Characteristics:- Low power of dissolution.- Mempnayi high mechanical strength.- Resistant to digestive enzymes.Examples of protein fibers:Collagen, elastin, keratin, myosin.
b. Globular proteins.Characteristics:- Form a ball.- Soluble in dilute acids and salt solutions.- Easily change the effect of temperature.- The concentration of salt prone to denaturation.Example:Albumin, globumin, histones, protamin.
c. Protein conjunctions.Is a simple protein that bound to the material non-amino acid (prosthetic group).Example:Nucleoprotein, lipoprotein, fosfoprotein, metaloprotein.
The types of protein:a. Based on Components.A. Protein Homely.An acid mixture consisting of Mino.2. Protein Complex.Besides consisting of amino acids are also contained other components (metals, phosphate groups, etc.).3. Protein.Is the bond between the intermediate products as a result of partial hydrolysis of the native protein.
b. Based on the source.A. Animal Protein.Derived from animals, eg meat, milk, etc..2. Vegetable Protein.Derived from plants, eg maize.
Classification of proteins can also be done by fisiologiknya function, associated with the dukunagn for body and for the maintenance prtumbuhan jeringan:a. Protein perfect.b. Protein half-perfect.c. Protein is not perfect.
3. Chemical composition of the protein.Proteins are macro molecules having a molecular weight of between five thousand to several million. Proteins consist of long chains of amino acids, which are bonded to each other in a peptide bond. More complex protein molecules of the carbohydrates and fats in terms of molecular weight and kanekaragaman amino acid units that formed it.Amino acids consist of carbon atoms bonded to one carboxyl group (-COOH), an amino group (-NH2), a hydrogen atom (-H) and a radical group (-R) or branched chain, as shown in the following figure:
In general, amino acid protein isolated from hididroksilat alpha-amino acids, ie amino guguskarboksil and bound to the same carbon atom. What distinguishes one another amino acid is a branched chain or its group-R.
4. Function, order, and Source of Protein.Here we can see the function of proteins, among others, as follows:a. For growth and maintenance.b. For the formation of the essential bonds of the body.c. To regulate water balance in the body.d. To maintain the neutrality of the body.e. For the formation of antibodies.f. To remove nutrients.g. As an energy source.Therefore, the protein is important in the human body, because man is not enough protein Bial, then they will be suffering from malnutrition.
Protein to the human body:Protein is very instrumental to the growth manusia.penting found in all living things. So in the absence of the protein can not be formed living cells. In order to outline the human protein is as follows:a. To build a network of cells of an infant born weighing 3 kg.b. To replace the body's cells are worn or damaged.c. To make milk, enzymes and hormones given mother's milk is made from mother's diet kepadabayinya itself.d. Make a blood protein, to maintain blood pressure osmose.e. To maintain body fluid balance basadari acid.f. As the giver of calories.
Source of protein.Source of protein for humans there are 2, namely:a. Source of animal protein.Animal foods are good sources of protein, the quantity and quality such as eggs, milk, meat, poultry, fish, and shellfish.b. Source of vegetable protein.Food sources such as: peanuts, soybeans, and the results are like tempeh, tofu, and other nuts.
5. Protein for Human Needs.The need for a human protein can be determined by calculating the amount of protein that was replaced in the body. This can be done by counting the number of elements nitrogn (limp substances) present in protein foods and also calculate the amount of elemental nitrogen is released by the body through urine and feces.The use of protein can be influenced by many factors, so in practice jumlahprotein it can not meet demand. Why, among others:- 18.75 grams protein levels in the body that will cause a chemical reaction that can not be progressing well.- Digestibility protein itself. Not all foods that contain protein fibers can be taken of the body. Because of these fibers, enzymes can not get to break down proteins.
Based on the above considerations, it is determined that the protein requirement for an adult is 1 gram for every kilogram of body weight every day. For children who are growing, need more protein, which is 3 grams per kilogram of body weight.In addition, given the existence of perfect and imperfect protein based on the number and kinds of amino acids in foods, to ensure that your body really get the amine acid in sufficient quantity and variety, preferably to an adult one-fifth of the proteins needed must be derived from animal protein, while for children-third of the total-protein they need.
Table: Number of protein adequacy by age group.NO age group (years) AKP (the PST) g / kgweightMale Female1 0 to 0.5 1.86(85% of breast milk) 1.86(85% of ASI)2 0.5 to 2.0 1.39(80% of breast milk) 1.39(80% of ASI)3 4-5 1.08 1.084 5-10 1.00 1.005 10-18 1.96 0.906 18-60 0.75 0.757 60 + 0.75 0.75Pregnant women 8 + 12 g / day9 mother breastfeeding the first 6 months. + 16 g / day10 Breast-feeding mothers the second 6 months + 12 g / day11 Breastfeeding mothers second year + 11 g / daySources: FAO / WHO / UNU, 1985PST: Worth Egg Protein.
CHAPTER IIIDISCUSSION
A. Protein Deficiency and Excess.a. As a result of protein deficiency.Lack of protein found in many low socioeconomic communities. Pure protein deficiency on the stage of causing severe kwashiorkor in children under five years old (toddlers). Protein deficiency is often found in conjunction with lack of energy that causes a condition called Marasmus.A. Kwashiorkor.The term was first introduced by Dr kwashiorkor. Cecily Williams in 1933, when he found the situation in Ghana, Africa. Kwashiorkor in Ghana where the disease is obtained by means of first child, when the second child was born ditungu.Kwashiorkor rely more widely available in two to three years of age are common in children who terlambatmenyapih, so that the nutritional composition of food is not balanced, especially in terms of protein. Kwashiorkor can terjadipada enough energy consumption or more.Symptoms:- Stunted growth.- The muscles is reduced and weakened.- Edema.- Round face like the moon (moonface)- Disturbance psikimotor.
The hallmark of kwashiorkor is edema in the abdomen, legs and hands. The presence of kwashiorkor is closely related to serum albumin. In the kwashiorkor children are very different clinical picture. Weight loss is not too low, even by the presence of edema can be closed, so that the relative weight loss is not too much, but when treatment odema disappear, then the low weight will begin to manifest themselves. Usually weight loss is not until below 60% of standard weight for age appropriate.Characteristics:- Hair fine, rare, and dull reddish blond.- The skin looks dry (xerosis) and gives the impression of a rough surface with lines clear.- Areas of legs and elbows and buttocks are shown Hyperpigmentation of skin and skin can be peeled off in large sheets, leaving the base smooth shiny white.- The child's stomach bulge due to enlargement of the liver.- On microscopic examination there perlemkan liver cells.
2. Marasmus.Marasmus comes from a Greek word that means wasting damage. Marasmus is generally a disease in infants (12 months), were given additional food for being late. This can occur due to abrupt weaning, breast milk substitute formula is too thin and not hygienic or frequent infections. Marasmus affects long as quickly to the difficult mental and physical repair.Marasmus is starvation and disease there are many among lower socioeconomic groups in most developing countries and more than kwashiorkor.Symptoms:- Growth is inhibited.- Reduced fat under the skin.- The muscles is reduced and weakened.- Closely body more affected than the frame size, such as: length, head circumference and chest circumference.- Face like an old man (Oldman's face).
In patients with marasmus usually no enlargement of the liver (hepatomegalia) and levels of fat and cholesterol in the blood decreases. Body temperature is also lower than the temperature of a healthy child, and children lay in-active, no attention to her surroundings.
b. Due to Excess Protein.Excessive protein is not profitable body. High protein foods are usually high in fat so that it can lead to obesity. High protein diets are often recommended for weight loss is less reasonable. Excess can cause other problems, especially in infants. Amino acid excess burden of kidney and liver to metabolize and remove excess nitrogen.Excess protein will lead to acidosis, dehydration, diarrhea, increase in blood ammonia, increase in blood urea, and fever. This is seen in infants fed skim milk or formula with a high concentration, so that protein intake to 6 g / kg. The recommended limit for protein consumption is twice the nutritional adequacy angaka RDA) for protein.
2. Efforts.To overcome the shortage / excess protein, then the response can be done as follows:- Monitoring of nutritional status (PSG) community.- The provision of supplementary food (PMT).- Monitoring of iodized salt.- Provision of vitamin capsules. A- Provision of iron tablets.- Data collection KADARZI.
CHAPTER IVCLOSING
A. Conclusion.Of the papers above, it can be concluded that the protein peulis very important, especially for growth. Besides, protein is the main substance in helping the development of the child. Enough so that when the protein intake of children, the child will grow sehta, away from malnutrition and the absence of growth disorders.In addition, protein is the largest energy producer. In the presence of protein in the body, the body will still feel fresh. But that must be considered for the body's protein intake should be balanced, not too short and not bileh excess. Because the excess or deficiency of protein intake can cause disease, such as kwashiorkor, marasmus, and obesity.Therefore, it is expected that the reader, to be able to capitalize on what was presented in this paper, in order to improve nutritional status in society, so as to create a healthy society.
2. Advice.a. It is hoped the whole community to be able to ensure adequate intake of protein, that can grow with less healthy.b. That all mothers of children pay attention to nutrition, especially protein intake, so there was no longer malnutrition.c. To health workers to be able to conduct outreach to the community about nutrition, especially of proteins.d. Expected by society or even the reader want to come and promote the program on the eradication of malnutrition, to achieve a healthy Indonesia 2010.
REFERENCES
A. Almatsier, S. "Basic Principles of Nutrition". Publisher: PT. Scholastic Press. New York: 2006.2. Sediaoetama, Drs. Ahmad Djaeni. "Nutritional Sciences". Publisher: Dian Rakyat. New York: 2006.3. Moehdi, S. "Nutritional Sciences". Publisher: Papasinar Sinanti. New York: 2002.4. Kartasapoetra, Drs.G. "Nutritional Sciences". Publisher: Rineka Notices. New York: 2003.5. http / / www.google.com//gizi bad / / 2008.6. http / / www.google.co.id//journal of the protein. / / 2008
A. Konsep Dasar
Malnutrisi dapat terjadi oleh karena kekurangan gizi (undernutrisi) maupun karena kelebihan gizi (overnutrisi). Keduanya disebabkan oleh ketidakseimbangan antara kebutuhan tubuh dan asupan zat gizi esensial. Adapun contoh yang termasuk undernutrisi yaitu marasmus dan kwashiorkor.
Secara klinik dibedakan dalam bentuk yaitu Kwashiorkor dan marasmus. Diantara kedua bentuk tersebut terdapat bentuk antara atau “ Marasmus Kwasiorkor “
a.Marasmus yaitu keadaan kurang kalori
b.Kwashiorkor yaitu keadaan kekurangan protein yang parah dan pemasukan kalori yang kurang Marasmus kwashiorkor yaitu keadaan peralihan antara marasmus dan kwashiorkor.
1. Marasmus
a. Pengertian Marasmus
Marasmus adalah bentuk malnutrisi kalori protein yang terutama akibat kekurangan kalori yang berat dan kronis terutama terjadi selama tahun pertama kehidupan dan mengurusnya lemak bawah kulit dan otot. (Dorland, 1998:649).
Marasmus adalah suatu penyakit yang disebabkan oleh kekurangan kalori protein ( suriadi,2001 : 196 ).


b. Etiologi
Penyebab utama marasmus adalah kurang kalori protein yang dapat terjadi karena diet yang tidak cukup, kebiasaan makan yang tidak tepat atau karena kelainan metabolik dan malformasi kongenital.
c. Tanda dan Gejala Pada mulanya ada kegagalan menaikkan berat badan, disertai dengan kehilangan berat badan sampai berakibat kurus,dengan kehilangan turgor pada kulit sehingga menjadi berkerut dan longgar karena lemak subkutan hilang dari bantalan pipi, muka bayi dapat tetap tampak relatif normal selama beberaba waktu sebelum menjadi menyusut dan berkeriput. Abdomen dapat kembung dan datar. Terjadi atropi otot dengan akibat hipotoni. Suhu biasanya normal, nadi mungkin melambat, kemudian lesu dan nafsu makan hilang. Biasanya terjadi konstipasi, tetapi dapat muncul apa yang disebut diare tipe kelaparan, dengan buang air besar sering, tinja berisi mucus dan sedikit.
d. PatofisiologiKurang kalori protein akan terjadi manakala kebutuhan tubuh akan kalori, protein, atau keduanya tidak tercukupi oleh diet. (Arisman, 2004:92). Dalam keadaan kekurangan makanan, tubuh selalu berusaha untuk mempertahankan hidup dengan memenuhi kebutuhan pokok atau energi. Kemampuan tubuh untuk mempergunakan karbohidrat, protein dan lemak merupakan hal yang sangat penting untuk mempertahankan kehidupan, karbohidrat (glukosa) dapat dipakai oleh seluruh jaringan tubuh sebagai bahan bakar, sayangnya kemampuan tubuh untuk menyimpan karbohidrat sangat sedikit, sehingga setelah 25 jam sudah dapat terjadi kekurangan. Akibatnya katabolisme protein terjadi setelah beberapa jam dengan menghasilkan asam amino yang segera diubah jadi karbohidrat di hepar dan ginjal. Selam puasa jaringan lemak dipecah menjadi asam lemak, gliserol dan keton bodies. Otot dapat mempergunakan asam lemak dan keton bodies sebagai sumber energi kalau kekurangan makanan ini berjalan menahun. Tubuh akan mempertahankan diri jangan sampai memecah protein lagi seteah kira-kira kehilangan separuh dari tubuh.
e. Pemeriksaan Penunjang1.Pemeriksaan Fisik
a. Mengukur TB dan BB
b. Menghitung indeks massa tubuh, yaitu BB (dalam kilogram) dibagi dengan TB (dalam meter)
c. Mengukur ketebalan lipatan kulit dilengan atas sebelah belakang (lipatan trisep) ditarik menjauhi lengan, sehingga lapisan lemak dibawah kulitnya dapat diukur, biasanya dangan menggunakan jangka lengkung (kaliper). Lemak dibawah kulit banyaknya adalah 50% dari lemak tubuh. Lipatan lemak normal sekitar 1,25 cm pada laki-laki dan sekitar 2,5 cm pada wanita.
d. Status gizi juga dapat diperoleh dengan mengukur LILA untuk memperkirakan jumlah otot rangka dalam tubuh (lean body massa, massa tubuh yang tidak berlemak).
2. Pemeriksaan laboratorium : albumin, kreatinin, nitrogen, elektrolit, Hb, Ht, transferin.
f. Penatalaksanaan Medis1. Keadaan ini memerlukan diet yang berisi jumlah cukup protein yang kualitas biologiknya baik. Diit tinggi kalori, protein, mineral dan vitamin.
2. Pemberian terapi cairan dan elektrolit.
3. Penatalaksanaan segera setiap masalah akut seperti masalah diare berat.
4. Pengkajian riwayat status sosial ekonomi, kaji riwayat pola makan, pengkajian antropometri, kaji manifestasi klinis, monitor hasil laboratorium, timbang berat badan, kaji tanda-tanda vital.
Penanganan KKP berat
Secara garis besar, penanganan KKP berat dikelompokkan menjadi pengobatan awal dan rehabilitasi. Pengobatan awal ditujukan untuk mengatasi keadaan yang mengancam jiwa, sementara fase rehabilitasi diarahkan untuk memulihkan keadaan gizi.
a- Pengobatan/pencegahan terhadap hipoglikemi, hipotermi, dehidrasi.
- Pencegahan jika ada ancamanperkembangan renjatan septik
- Pengobatan infeksi
- Pemberian makanan
- Pengidentifikasian dan pengobatan masalah lain, seperti kekurangan vitamin, anemia berat dan payah jantung.
2. Kwashiorkor
a. Pengertian Kwashiorkor
Kwashiorkor ialah suatu keadaan kekurangan gizi ( protein ). Walaupun sebab utama penyakit ini adalah defisiensi protein, tetapi karena bahan makanan yang dimakan kurang mengandung nutrisi lainnya ditambah dengan konsumsi setempat yang berlainan, maka akan terdapat perbedaan gambaran kwashiorkor di berbagai negara.
b. EtiologiSelain oleh pengaruh negatif faktor sosial ekonomi, budaya yang berperan terhadap kejadian malnutrisi umumnya, keseimbangan nitrogen yang negatif dapat pula disebabkan oleh diare kronik, malabsorpsi protein, hilangnya protein melalui air kemih ( sindrom nefrotik ), infeksi menahun, luka bakar dan penyakit hati.
c. Patofisiologipada defisiensi protein murni tidak terjadi katabolisme jaringan yang sangat berlebihan, karena persediaan energi dapat dipenuhi oleh jumlah kalori dalam dietnya. Kelainan yang mencolok adalah gangguan metabolik dan perubahan sel yang menyebabkan edema dan perlemakan hati. Karena kekurangan protein dalam diet, akan terjadi kekurangan berbagai asam amino esensial dalam serum yang diperlukan untuk sintesis dan metabolisme. Bila diet cukup mengandung karbohidrat, maka produksi insulin akan meningkat dan sebagian asam amino dalam serum yang jumlahnya sudah kurang tersebut akan disalurkan kejaringan otot. Makin berkurangnya asam amino dalam serum ini akan menyebabkan kurangnya produksi albumin oleh hepar, yang kemudian berakibat timbulnya edema. Perlemakan hati terjadi karena gangguan pembentukan beta- lipoprotein, sehingga transport lemak dari hati terganggu, dengan akibat adanya penimbunan lemak dalam hati.
d. Gejala Kwashiorkor - Pertumbuhan terganggu, BB dan TB kurang dibandingkan dengan yang sehat.
- Pada sebagian penderita terdapat edema baik ringan dan berat
- Gejala gastrointestinal seperti anoreksia dan diare
- Rambut mudah dicabut, tampak kusam kering, halus jarang dan berubah warna
- Kulit kering dengan menunjukan garis – garis kulit yang mendalam dan lebar, terjadi persisikan dan hiperpigmentasi
- Terjadi pembesaran hati, hati yang teraba umumya kenyal, permukaannya licin dan tajam.
- Anemia ringan selalu ditemukan pada penderita.
- Kelainan kimia darah yang selalu ditemukan ialah kadar albumin serum yang rendah, disamping kadar globulin yang normal atau sedikit meninggi.
e. Pemeriksaan LabolaturiumHampir semua kasus kwashiorkor memperlihatkan penurunan kadar albumin, kolestrol dan glukosa dalam serum. Kemudian pada umumnya kadar imunoglobulin serum normal, bahkan dapat meningkat. Meskipun kadar IgA sekretori merendah.Gangguan imunitas seluler khususnya jumlah populasi sel T merupakan kelainan imunologik yang paling sering dijumpai pada malnutrisi berat.
B. Konsep Dasar Asuhan Keperawatan dengan Malnutrisi
1. Pengkajian
a. Anamnesa
• Bidata, umur, pekerjaan, pendidikan dan alamat
• Data subjektif
- bagaimana nafsu makan klien
- berapa kali makan dalam sehari
- banyaknya makan dalam satu kali makan
- apakah ada mual muntah
- bagaimana pola eliminasinya
- apakah ada anoreksia
• Data Objektif
- bagaimana nafsu makan klien
- berapa kali makan dalam sehari
- banyaknya makan dalam satu kali makan
- apakah ada mual muntah
- bagaimana pola eliminasinya
- apakah ada anoreksia
b. Pemeriksaan Fisik • Inspeksi
- lihat keadaan klien apakah kurus, ada edema pada muka atau kaki
- lihat warna rambut, kering dan mudah dicabut
- mata cekung dan pucat
- pada marasmus terlihat pergerakan usus
• Auskultasi
- dengar denyut jantung apakah terdengar bunyi S1, S2, S3 serta S4
- bagaimana dengan tekanan darahnya
- dengarkan juga bunyi peristaltik usus
- bunyi paru – paru terutama weezing dan ronchi
• Perkusi
- perut apakah terdengar adanya shitting duilnees
- bagaimana bunyinya pada waktu melakukan perkusi
• Palpasi
- hati : bagaimana konsistensi, kenyal, licin dan tajam pada permukaannya
berapa besarnya dan apakah ada nyeri tekan
pada marasmus usus terasa dengan jelas
- limpa : apakah terjadi pembesaran limpa
- tungkai : apakah ada pembesaran pada tungkai
c. Pemeriksaan Labolatorium• Biokimia : * Hb anemia
* kadar albumin yang rendah
* kadar globulin kadang – kadang rendah dan tinggi
* kadar asam amino biasanya kurang dari satu
• Biopsi : ditemukan perlemakan pada hati, dan terjadinya nekrosis dan infiltrasi
• Autopsi : hampir semua organ tubuh mengalami degenerasi seperti jantung, tulang
d. Diagnosa yang mungkin timbul dan intervensinya
1. Gangguan nutrisi sehubungan dengan intake nutrisi yang kurang, ditandai dgn:
• DS : - Klien mengeluh badan lemah
- anoreksia
- lesu
- mudah lelah
• DO: - berat badan turun
- berat badab tidak sesuai dengan tinggi badan
- edema
- rambut kering, kusam, jarang, putih dan mudah dicabut
- kulit kering dan bersisik
- hepar membesar
- hb rendah
- mata pucat dan cekung
Tujuannya :
- badan tidak lemah
- nafsu makan membaik
- ceria dan segar
- BB normal
- edema hilang
- rambut distribusi rata, hitam nampak berminyak
- hb normal
- hepar tidak membesar
Intervensi :
- berikan makanan TKTP, dilakukan secara bertahap
- hidangkan makanana dalam keadaan hangat
- observasi intake dan output
- observasi TTV
- kolaborasi dengan dokter ( untuk pemberian vitamin ) dan gizi ( untuk makanannya ).
- penyuluhan kesehatan
-
2. Gangguan pamanuhan kebutuhan cairan dan elektrolit yang ditandai dengan :
• DS : klien mengeluh mual, badan lemah, Anoreksia, kadang – kadang muntah
• DO : diare, BB turun, turgor jelek, mata cekung
Tujuannya :
- mual – mual berkurang
- badan tidak lemah
- nafsu makan membaik
- muntah berkurang
- diare berkurang
- BB normal
- turgor kulit baik, kenyal
- mata tidak cekung
Intervensi :
- berikan banyak minum
- catat intake dan output
- observasi TTV
- Kolaborasi dengan dokter untuk memberikan cairan parental dengan nutrisi tinggi
-
3. Potensial terjadinya infeksi sekunder sehubungan dengan pertahaan tubuh yang kurang adekuat ditandai dengan :
- badan lemah
- lesu
- pusing
- Hb rendah
- BB tidak sesuai dengan tinggi badan
- mata pucat
Tujuannya :
- badan tidak lemah dan ceria
- pusing berkurang
- Hb normal kembali
- BB normal kembali
- mata tidak pucat
Intervensi :
- berikan makanan TKTP
- isolasi penderita
- monitoring TTV
- kolaborasi : laporkan segera adanya tanda – tanda khusus yang menyangkut keadaan klien.

Minggu, 03 Juni 2012

Description and Significance

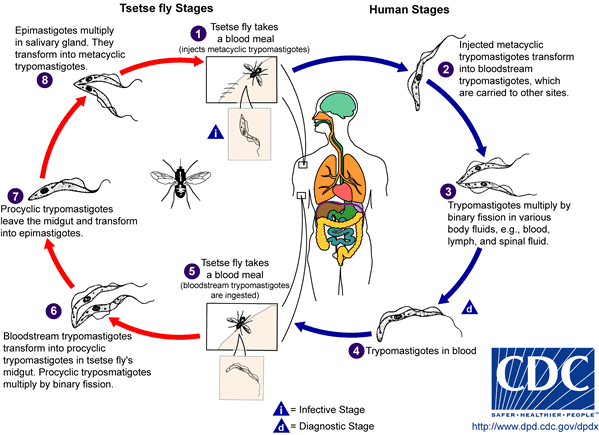
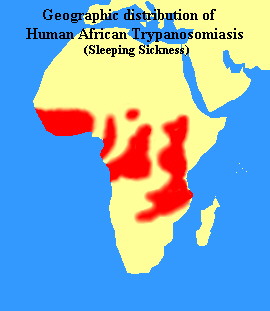
The genus Trypanosoma contains a large number of parasitic species which infect wild and domesticated animals and humans in Africa. Commonly known as African sleeping sickness, human trypanosomiasis is caused by the species Trypanosoma brucei and is transmitted to humans through either a vector or the blood of ingested animals. The most common vector of Trypanosoma brucei is the tsetse fly, which may spread the parasite to humans and animals through bites. Through a process known as antigenic variation, some trypanosomes are able to evade the host's immune system by modifying their surface membrane, esentially multiplying with every surface change. As the disease progresses, Trypanosoma brucei gradually infiltrates the host's central nervous system. Symptoms include headache, weakness, and joint pain in the initial stages; anaemia, cardiovascular problems, and kidney disorders as the disease progresses; in its final stages, the disease may lead to extreme exhaustion and fatigue during the day, insomnia at night, coma, and ultimately death. Human trypanosomiasis affects as many as 66 million people in sub-Saharan Africa.
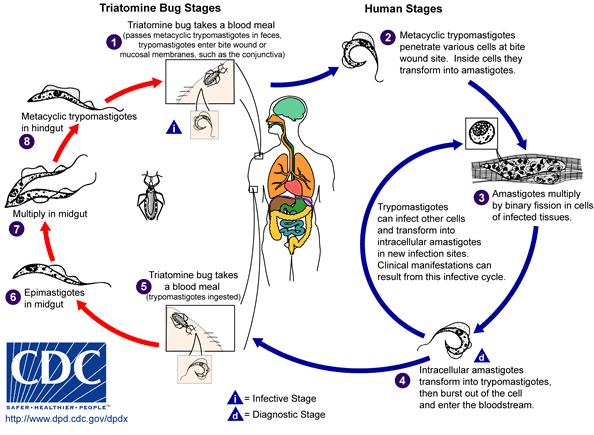
Trypanosomes are also found in the Americas in the form of Trypanosoma cruzi, which causes American human trypanosomiasis, or Chagas' disease. This disease is found in humans in two forms: as an amastigote in the cells, and as a trymastigote in the blood. The vectors for Trypanosoma cruzi include members of the order Hemiptera, such as assassin flies, which ingest the amastigote or trymastigote and carry them to animals or humans. The parasites enter the human host through mucus membranes in the nose, eye, or mouth upon release from the insect vectors. Left untreated, Chagas' disease may cause dementia, megacolon, and megaesophagus, and damage to the heart muscle, and may result in death.

Genome Structure


Eleven chromosomes of Trypanosoma's DNA have been sequenced or are in the process of being sequenced by the Sanger Institute and TIGR. Chromosome I's sequence has been completed and has yielded 400 genes and five novel gene families. 99-100% of gene pairs were indentical, leading scientists to believe that an active process of amplification and gene conversion may be present.

Cell Structure and Metabolism

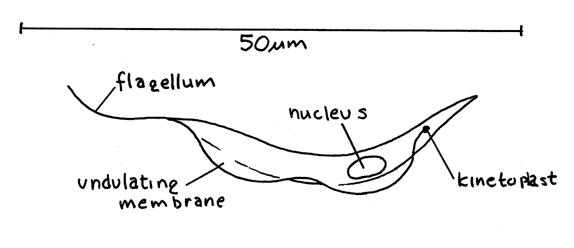
Trypanosome cells are small and heterotrophic; they share common characteristics with other members of the phylum Euglenozoa, particularly the stiffening paraxial rod in the flagellum, and characteristics common to the order Kinetoplastida, specifically a large clump of DNA located at one end of the unusually long mitochondrion known as the kinetoplast. Trypanosoma's cell structure plays a vital role in allowing the cell to morph into three forms (trypomastigote, epimastigote, and amastigote) during its lifecycle, depending on where the cell is located in the host's anatomy. The location of the kinetoplast in relation to the nucleus and the flagellum emergence dictate in which stage the trypanosome cell is found. Key sources of the cell's energy, for example acid calcisomes and reservosomes, continue to intrigue scientists. Drug studies that have been performed in order to curb the parasite's energy have yielded information regarding energy-producing glycosomal enzymes, purine and sterol byosynthetic pathways. Trypanosoma uses several methods in order to penetrate the host's cell: active penetration, active induction of receptor-mediated phagocytosis, and opsonin-mediated phagocytosis. The cell's unique structure allows the trypanosome to invade the host cell usually with little or no difficulty, resulting eventually in cell rupture, release of trypomastigotes, and their subsequent multiplication. Trypanosoma cruzi cells differ from their African relatives (Trypanosoma brucei) in that no replication occurs in the bloodstream; rather, the cells are only able to replicate after another cell has been penetrated.

Cell Structure of Trypanosoma

Image by Richard Fox.

Life Cycle of Trypanosoma brucei

Life Cycle of Trypanosoma cruzi

Ecology

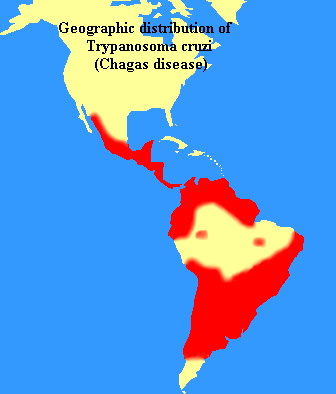
Trypanosoma brucei and Trypanosoma cruzi are parasites--therefore the ecology of their vector and host is the ecology of the species itself. The most common carrier of Trypanosoma brucei is the tsetse fly, native to Africa. The three species of tsetse fly vectors are most prevalent in Western and Central Africa, although some are found more sproadically in the Eastern and Southern parts of the continent. The tsetse fly's habitat varies, depending on the species of fly and its location, but climate and altitude are a determining factor in their distribution. An increase in the number of diagnosed cases of sleeping sickness in the past forty years has prompted mass migrations from the politically charged areas of Western and Central Africa to places previously virtually uninhabited by humans. Trypanosoma cruzi is found in many countries in the Americas, and is carried by insects to animals and human in much the same way as its African counterpart, although rather than the tsetse fly, the vecters are bedbugs or "assassin" flies. Trypanosoma cruzi was once thought to be confined to Brazil and its surrounding area, but recently cases of Chagas' disease have been reported as far north as southern North America. Immigrants from Central America and Mexico are thought to be the cause of the disease's migration northward.
Tc2.jpg
Tryp2.jpg
Acidimetry AND ALKALIMETRI
ABSTRACT
Acidimetry is titrimetric analysis using a strong acid as the analyte is titrannya and as a base or an alkaline compound. While in principle alkalimetri is titrimetric analysis using a strong base as titrannya and analyte is an acid or an acidic compound. This experiment aims to create a standard solution of 0.1 N HCl and the concentration of the solution set by means of standardization with a solution of borax and sodium carbonate anhydrous, create a primary standard solution of oxalic acid and acetic acid to determine the levels of trade.
In this experiment a solution prepared by dilution titration was then performed with standard solutions of certain so we get the price of diluting the concentration of the solution. Also in this experiment used titrimetric method to analyze the content of a sample of the process and alkalimetri acidimetry.
Experimental results obtained from the standardized solution of HCl is 0.0662 N and 0.867 N NaOH solution and the results are standardized 0.0113 N, while acetate levels studied were 0.24%, and NH3 levels contained in 0.2 grams of NH4Cl amounted to 10.75%.
Keywords: acidimetry, alkalimetri, the standard solution.
EXPERIMENT 1
Acidimetry AND ALKALIMETRI
1.1 Introduction
1.1.1 Objectives Experiment
The purpose of this experiment are:
A. Creating a standard solution of HCl 0.1 N and to determine the concentration of standard solution of HCl with a standardized way with a solution of borax (Na2B4O7.10H2O) and anhydrous Na2CO3.
2. Creating a standard solution of NaOH and standardized with oxalic acid.
3. Determine the levels of acid in vinegar traded and determine the levels of NH3 in the ammonium salt (NH4Cl).
1.1.2 Background
In principle acidimetry is titrimetric analysis using a strong acid as the analyte is titrannya and as a base or an alkaline compound, or measuring the acid (which measured the number of bases or salts). While in principle is alkalimetri titimetri analysis using a strong base as titrannya and the analyte is an acid or an acidic compound.
Solution commonly used as a titrant in alkalimetri is NaOH, KOH, and Ba (OH) 2 which is a standard solution of the secondary standard. Solution commonly used in this analysis because it is relatively inexpensive NaOH.
Indicators are often used in the experiment alkalimetri acidimetry and is an indicator of methyl red and methyl orange for acidimetry because the pH scale ranges on both indicators are in the acidic solution and an indicator for alkalimetri PP because PP indicator scale ranges of pH on the alkaline solution.
1.2 BASIC THEORY
In the analysis of acid and alkaline solution, the titration will involve a careful measurement of the volume-volume of an acid and an appropriate base menetra1kan each other. Neutralization reaction or acidimetry and alkalimetri is one of the four main groups in the classification of reactions in titrimetric analysis. Asidi alkalimetri involves titration of the free base or base formed by hydrolysis of salts derived from weak acids, with a standard (acidimetry) and titrate the free acid formed by hydrolysis of salts derived from weak bases, with a standard base (alkali metri). These reactions involve compounds of hydrogen ions and hydroxide ions to form water (Bassett, 1994).
Volumetric analysis is also known as titrimetry, in which substances are allowed to react with other substances known concentration and flow of the burette in solution form. Solution of unknown concentration (analyte) is then calculated. The condition is that the reaction must take place quickly, the reaction is quantitative and no side reactions (Khopkar, 1990).
In a reaction test to determine whether the reaction can be used for a titration, making the titration curve will help the understanding of acid-base titration to a titration curve consists of a groove or pOH pH versus mL of titrant. Such a curve is helpful in considering the feasibility of a titration and in selecting appropriate indicators (Underwood, 1999).
Inorganic substances can be classified into three important groups: acids, bases and salts. Acid is defined as a substance that when dissolved in water, dissociating with the formation of hydrogen ions as the only positive ions. Strong acids dissociate almost perfectly with the dilution medium, because he is a strong electrolyte. Weak acids dissociate only slightly in the concentration was even at low concentrations (Svehla, 1990).
Relatively strong acids and bases in solution depends on their affinity for different protons. The stronger the acid, the weaker its conjugate base. From the collection of chemical reactions known relatively little that can be used as the basis for the titration, a reaction to meet the following requirements prior to use.
A. The reaction must be run in accordance with a particular equation. There should be no side reactions.
2. The reaction had to walk up to virtually complete at the equivalence point. In other words, the reaction equilibrium constants must be very large.
3. Some method should be available to determine when the equivalence point is reached. A inidikator or some method must be available in the instrument can be used to inform the analysis is stopped when the addition of titrant.
4. The reaction runs quickly (in minutes)
(Day and Underwood, 1999).
For the acid-base indicators are usually made in the form of an aqueous acid-base indicators are substances that change color or form a fluorescent or turbidity in a range (route) a certain pH. Acid-base indicator is located at the equivalence point and the size of the pH. These substances may be an indicator of acid or base, soluble and stable and will show a strong color change, usually an organic substance (Khopkar, 1990).
Pure water has no taste, odor, and color. When it contains certain substances, water may tersa sour, bitter, salty, and so forth. Water that contains other substances can also be color. Sour liquid that is called an acid solution, which was called salty saline solution, whereas that feels slippery and bitter called the base solution (Shukri, 1999).
Inorganic substances can be classified into three important groups: acids, bases, and salts. Acid is most simply defined as a substance, which when dissolved in water, dissociating with the formation of hydrogen ions as the only positive ions. Basa, in the simplest can be defined as a substance, which when dissolved in IAR, dissociating with the formation of hydroxyl ions as the only negative ion (Svehla, 1979).
Ion in water containing very small amounts. This was caused by the occurrence of acid-base reaction among the molecules of water (autoionisasi) and establish the equilibrium:
H2O + H2O H3O + + OH-
In other words, water is a weak electrolyte and simplified into a H3O + when H +, the equilibrium is written as:
H2O H + + OH-
If the solution is acidic, then add the number of H +, and will shift the equilibrium to the left until a new equilibrium is reached. In the new equilibrium, the concentration of H + is greater than the OH-, but still perkaliannya 10-14. The same thing will happen when the water plus the bass so that the new equilibrium is achieved with a value of [OH-]> [H +] and remained perkaliannya 10-14.
Based on the ion concentration, the solution was divided into three, namely:
Acid solution: [H +]> [OH-]
Neutral solution [H +] = [OH-] = 10-7
Base solution: [H +] <[OH-]
(Shukri, 1999).
Titrimetric analysis is one of the major divisions in analytical chemistry. Calculations contained herein is based on the relationship stokiometrik of simple chemical reactions.
Titrimetric method of analysis based on chemical reactions such as:
aA + tT product
In which a molecule of the analyte, A, reacts with the reagent molecules t, T. Reagent T, called the titrant, is added continuously, usually from a burette, in the form of a solution of known concentration. This solution is called the standard solution, and its concentration determined by a process called standardization. The addition of titrant is still being done until the number of T is chemically the same as that has been added to A. then be said to be the equivalence point of titration was achieved. In order to know when to stop adding titrant, it can use chemicals, the indicators, which reacts to the presence of excess titrant with a color change. This discoloration may occur exactly at the equivalence point, but could not. Point in the titration where the indicator changes color is called the end point (Day and Underwood).
The indicator is a soluble dye which changes color as is evident in a narrow pH range. Typical types of indicators are weak organic acids that have a different color from its conjugate base. A good indicator has a color intensity such that only a few drops of dilute indicator solution should be added to the solution being tested. Concentration of molecules at a very low indicator is almost no effect on the pH of the solution. The color change indicator reflects the influence of other acids and bases contained in the solution (Oxtoby, 2001).
Chemical reactions may be treated as the basis of titrimetric determination has been grouped into four types:
a. Acid-Base. There are a large number of acids and bases which can be determined by titrimetry. If HA represents the acid to be determined, and B represents the base, are as follows rekasinya
HA + OH-A-+ H2O
and
BH + B + H3O + + H2O
b. Oxidation-reduction (redox). Chemical reaction involving oxidation-redoksi widely used in titrimetric analytical. For example, iron in the +2 oxidation rate can be titrated with a standard solution of cerium (IV) sulfate:
Fe2 + + Ce 4 + Fe3 + + Ce3 +
c. Deposition. Deposition of silver cations by halogen anions are widely used in the procedure titremetrik. His reaction is as follows
Ag + + X-AgX (s)
d. Complex formation. Examples of reactions in which a complex formed between silver and cyanide ion:
Ag + + 2 CN-Ag (CN) -2
(Oxtoby, 2001).
So far, relative few chemical reactions that could be used as a basis for the titration. A reaction must satisfy several conditions before the reaction can be used:
a. The reaction should be processed according to the equation given kimiwai. There should be no side effect.
b. The reaction should be processed until it is completely finished at the point of equivalence.
c. Should be available several methods to determine when the equivalence point is reached.
d. Reaction is expected to run faster, so that the titration can be completed within a few minutes (Day and Underwood, 1999).
1.3 METHODOLOGY EXPERIMENT
1.3.1 Tool
The tools used in this experiment is Bekker glass, Erlenmeyer, a graduated cylinder, volumetric flask, pipette drops, funnels, burette, watch glass, stir bar, and propipet volume pipette, spatula, analytical balance, heating.
Tools series:
Description:
1.buret
2. stative and klef
3. erlenmeyer
Figure 1.1 Tool titration
1.3.2 Material
The materials used in these experiments were concentrated HCl, distilled water, borax, Na2CO3, oxalic acid (H2C2O4.2H2O), ammonium chloride (NH4Cl), vinegar, PP indicator, methyl red indicator, the indicator orange metal, NaOH crystals
1.3.3 Experimental Procedure
1.3.3.1 Standardization of the Borax
A. Appropriately weigh 0.2 grams of borax, put into the Erlenmeyer and dissolve as much as 25 mL with distilled water and whisk until dissolved.
2. Add indicators as much as 3 drops of methyl red. Titrate with the HCl solution from the previous experiments so that the color change from yellow to pink. Titrannya volume recorded.
3. Conduct experiments on a total of two times.
1.3.3.2 Standardisation with anhydrous Na2CO3
A. Weighing 0.2 grams of Na2CO3. Dissolving in distilled water in a total of 60 mL erlenmeyer and shake well.
2. Add indicators as much as 3 drops orange metal. Titrate with the HCl solution until the color changed from orange to pink warma. Titrannya volume recorded.
3. Conduct experiments on a total of two times.
1.3.3.2 Standardization of NaOH with Oxalic Acid
A. Weighing 0.63 grams of oxalic acid with a watch glass. Entering into a 250 mL erlenmeyer. dissolve in water to a volume of 100 mL.
2. Take as many as 10 mL and add as many as 3 drops of indicator PP.
3. Titrate with NaOH until the solution becomes pink color and notes titrannya volume.
4. Conduct the experiment twice.
1.3.3.3 Determining the levels of NH3 in Ammonium Chloride
A. Weighing 0.2 grams NH4Cl and incorporate it into 250-ml erlenmeyer. Add 75 mL of NaOH solution that has been standardized.
2. Whisk well and heat until steam came out did not change the color of litmus paper that has been moistened with distilled water.
3. Add 3 drops of methyl red indicator and titrate with standard solution of HCl to the equivalence point.
4. Percoaan perform twice.
1.3.3.4 Determination of Levels of Amino Acids in Vinegar Traded
A. Weighed flask, then enter 5 mL vinegar, weighing more example, and then calculate the weight of cukanya acid.
2. Memipet 10 mL of vinegar into the erlenmeyer and add 3 drops of indicator PP.
3. Titrating with standard NaOH solution until the pink color. Titrannya volume recorded.
4. Conduct the experiment twice.
1.4 RESULTS AND DISCUSSION
1.4.1 Results
1.4.1.1 Acidimetry
1.4.1.1.1 Standardization of the Borax
Table 1.4.1 Standardization of the Borax
No. Step Experiment Observations
A. Weighing 0.2 grams Borax, dissolved in 25 ml distilled water as a homogeneous mixture is translucent colors
2. Add 3 drops of methyl red yellow color
3. Titrate with HCl V0 = 0 ml
V1 = 13.1 ml,
 V = 13.1 ml
the color pink
1.4.1.1.2 Standardisation with anhydrous Na2CO3
Table 1.4.2 Standardisation with anhydrous Na2CO3
No. Step Experiment Observations
A. Weighing 0.2 grams Borax, dissolved in 25 ml distilled water as clear color
2. Add 3 drops of methyl orange yellow color
3. Titrate with HCl V0 = 0
V1 = 59.4 ml
 V = 59.4 ml
1.4.1.2 Alkalimetri
1.4.1.2.1 Creating a standard solution of NaOH
Table 1.4.3 Creating Standard NaOH solution
No. Step Experiment Observations
A. Weighing 1 g NaOH, dissolve with V = 250 ml distilled water
1.4.1.2.2 Standardization of NaOH with Oxalic Acid
Table 1.4.4 Standardization of NaOH with Oxalic Acid
No. Step Experiment Observations
A. Weighing 0.6 grams of oxalic acid
2. Entering the erlenmeyer and add water V = 100 ml
3. Take as many as 10 ml solution of oxalic translucent colors
4. Add 3 drops of clear color PP
5. Titrate with NaOH ml V1 = 0, V2 = 10 ml
 V = 10 ml
the color pink
1.4.1.2.3 Determining the levels of NH3 in NH4Cl
Table 1.4.5 Determining the levels of NH3 in NH4Cl
No. Step Experiment Observations
A. Considering NH4Cl, enter into erlenmeyer, add a solution of NaOH in 75 ml of 0.2 g mass
2. Whisk and heat the transparent color
3. Add 3 drops of methyl red-yellow color
4. Titrate with HCl ml V1 = 0, V2 = 59.4 ml
 V = 59.4 ml
pink
1.4.1.2.3 Determining the levels of acid in vinegar traded
Table 1.4.6 Determining the levels of acid in vinegar traded
No. Step Experiment Observations
A. Weighing 195.9 grams of empty bottles
2. Considering acetic acid + 5 ml bottle is empty
Weight of acetic acid =
200.4 to 195.9 = 4.5 grams
3. Incorporate vinegar into a 250 ml volumetric flask and add distilled water
to mark boundaries V = 250 ml
3. Memipet 10 ml of vinegar into the erlenmeyer and add 3 drops of indicator PP
clear color
4. Titrating with standard NaOH ml V1 = 0, V1 = 1.7 ml
 V = 1.7 ml
1.4.2 Discussion
1.4.2.1 Acidimetry
1.4.2.1.1 Standardization of the Borax
The first is to make a solution of borax, borax mass to make a standard solution that is 0.2 grams. BM borax = 384.4 g / mol and the total dilution volume of 25ml. Of several variables on the reaction solvent borax can be seen as follows:
Na2B4O7 H2B4O7 2H2O + NaOH + 2
After that add the red metal indicator so that as many as 3 drops of the color changes to yellow in borax. This is because the indicator methyl red has a pH of 4.2 to 6.3 yellow route if the alkaline solution. Then the solution was titrated with 0.1 N HCl Titration was performed until the yellow color changed to pink. This discoloration is due to the H + ion from HCl and this change marked the end point of titration. HCl solution was standardized by titration Na2B4O7.10H2O intended to eliminate the CO2 gas that is formed so as to make the indicator change the color of the solution
The reaction is as follows:
Na2B4O7.10H2O + + 2HCl 4H3BO3 2NaCl + · 5H2O
or Na2B4O7.5H2O + + 2HCl 2NaCl 4H3BO4
From the data obtained can be calculated normality of a solution of HCl is 0.077 N.
1.4.2.1.2 Standardisation with anhydrous Na2CO3
Standardization of HCl solution made by dissolving 0.2 grams of Na2CO3 and make up to volume 60 ml dilution. Then added with 3 drops of methyl-orange indicator, and then titrated with a solution of HCl. Na2CO3 solution acts as a default solution because kepekatannya known in molarity.
The reaction between Na2CO3 and HCl that occur are:
2Na + +2 + CO3-H2CO3 HCl + Cl +2 NaCl
In a brief written:
Na2CO3 + H2O + CO2 2NaCl
Repetition of the experiment can be titrated volume of 59.4 ml and the concentration of Na2CO3 of 0.0628 N and 0.0594 for V titrant, V titrannya because pH at the titration end point is greater than the pH indicator methyl red route. PH at the first titration end point is 8.3 for NaHCO3 salts formed a slightly alkaline pH and route of methyl red indicator parlu HCl from 4.4 to 6.2 so many to reach the route PH
1.4.2.2 Alkalimetri
1.4.2.2 Preparation of standard solution of NaOH 1
In this experiment the standard NaOH solution obtained by dissolving 1 gram of NaOH to 250 ml with distilled water. NaOH solution in a previously heated to be crushed and dissolved solids with distilled water. Standard solution of NaOH used for further calculations, and to titrate.
NaOH dissolution reaction is as follows:
H2O + NaOH Na + + OH-+ H2O
Based on calculations derived NaOH concentration of 0.1 N.
1.4.2.2.2 Standardization of NaOH with oxalic acid
At the time of a solution of oxalic acid is titrated with standard NaOH solution previously generated a reaction occurs as follows:
C2H2O4. 2H2O + NaOH + CO2 + H2O NaCHO4
The titration was stopped after the solution is initially translucent color turns pink. The color change occurs indicates that the equivalence point has been reached, after titration with NaOH normality obtained was 0.1332 N oxalic acid and 0.1 N NaOH for V titrannya because oxalic acid requires OH-ion is much more to reach the equivalence point so that the volume of titrant dipergunakanpun more.
1.4.2.2.3 Determination of levels of NH3 in Ammonium Chloride
To find out how much the content of NH3 in NH4Cl, first weighing is done as much as 0.2 grams of NH4Cl included in the erlenmeyer and then added 75 ml of NaOH solution has been made then shaken and heated. Drops of methyl red after new heated titrated with HCl
At the time of addition of NaOH to a solution of NH4Cl, the reaction occurs as follows:
NH4Cl + NaOH NaCl + H2O + NH3
Titration the following reaction:
HCl + NaOH NaCl + H2O
From the calculation results obtained in NH4Cl NH3 levels at 50.45%, V same as above titration of PH at the end point. Fewer base titration, as there is a weak base ammonia, and pH indicator methyl red trajectory of 4.4 to 6.2, so it needs more HCl.
1.4.2.2.4 Determination of acidity in the vinegar-traded
In this experiment, praktikan use vinegar as a sample brick cap. Initially taken a lot of vinegar 5 ml, then determined the weight and diluted. After that PP added indicator to indicate the end point when the vinegar was titrated with NaOH standard solution.
Reactions that occur during the titration as follows:
CH3COOH + NaOH + H2O CH3COONa
Acetic acid (CH3COOH) is one example protolit weak, the molecule or ion that can be gained with the balance of acidic protons is determined by the constant protolisisnya basanya. Vinegar or acetic acid are known to frequently used should be diluted with water first because if it is not harmful to the wearer.
Calculation of vinegar acid levels was performed to compare levels of acid contained in the label with the experiments performed. In 5 ml vinegar sample contained 0.0816 grams of CH3COOH to levels around 1.8133%.
1.5 CONCLUSION
1.5.1 Conclusion
A. To standardize a solution of 0.0418 N BORAX required by 25 ml 0.0134 ml or 13.4 ml of HCl solution with a concentration of normality of 0.0779 N
2. Standard solution of HCl 0.1 N as much as 59.4 ml is used to standardize the Na2CO3 solution with a concentration of 0.0634 N normality
3. To make 1 gram of NaOH with a concentration of normality of 0.1 N
4. In the standardized solution of 0.1332 N oxalic needed as much as 100 ml 1 N NaOH standard solution of 10 ml
5. NH3 levels are contained in 0.2 grams of NH4Cl is 50.45%
6. Acid levels contained in 5 ml vinegar bottle cap is equal to 1.8133%.
1.5.2 Suggestions
A. Tools should be used at trial insufficient and in accordance with the experiments, so praktikan not get into trouble because of lack of equipment.
2. Laboratory assistant jobs should pay more attention to avoid mistakes praktikan procedure.